

- May 7 2025
- Don Friddell
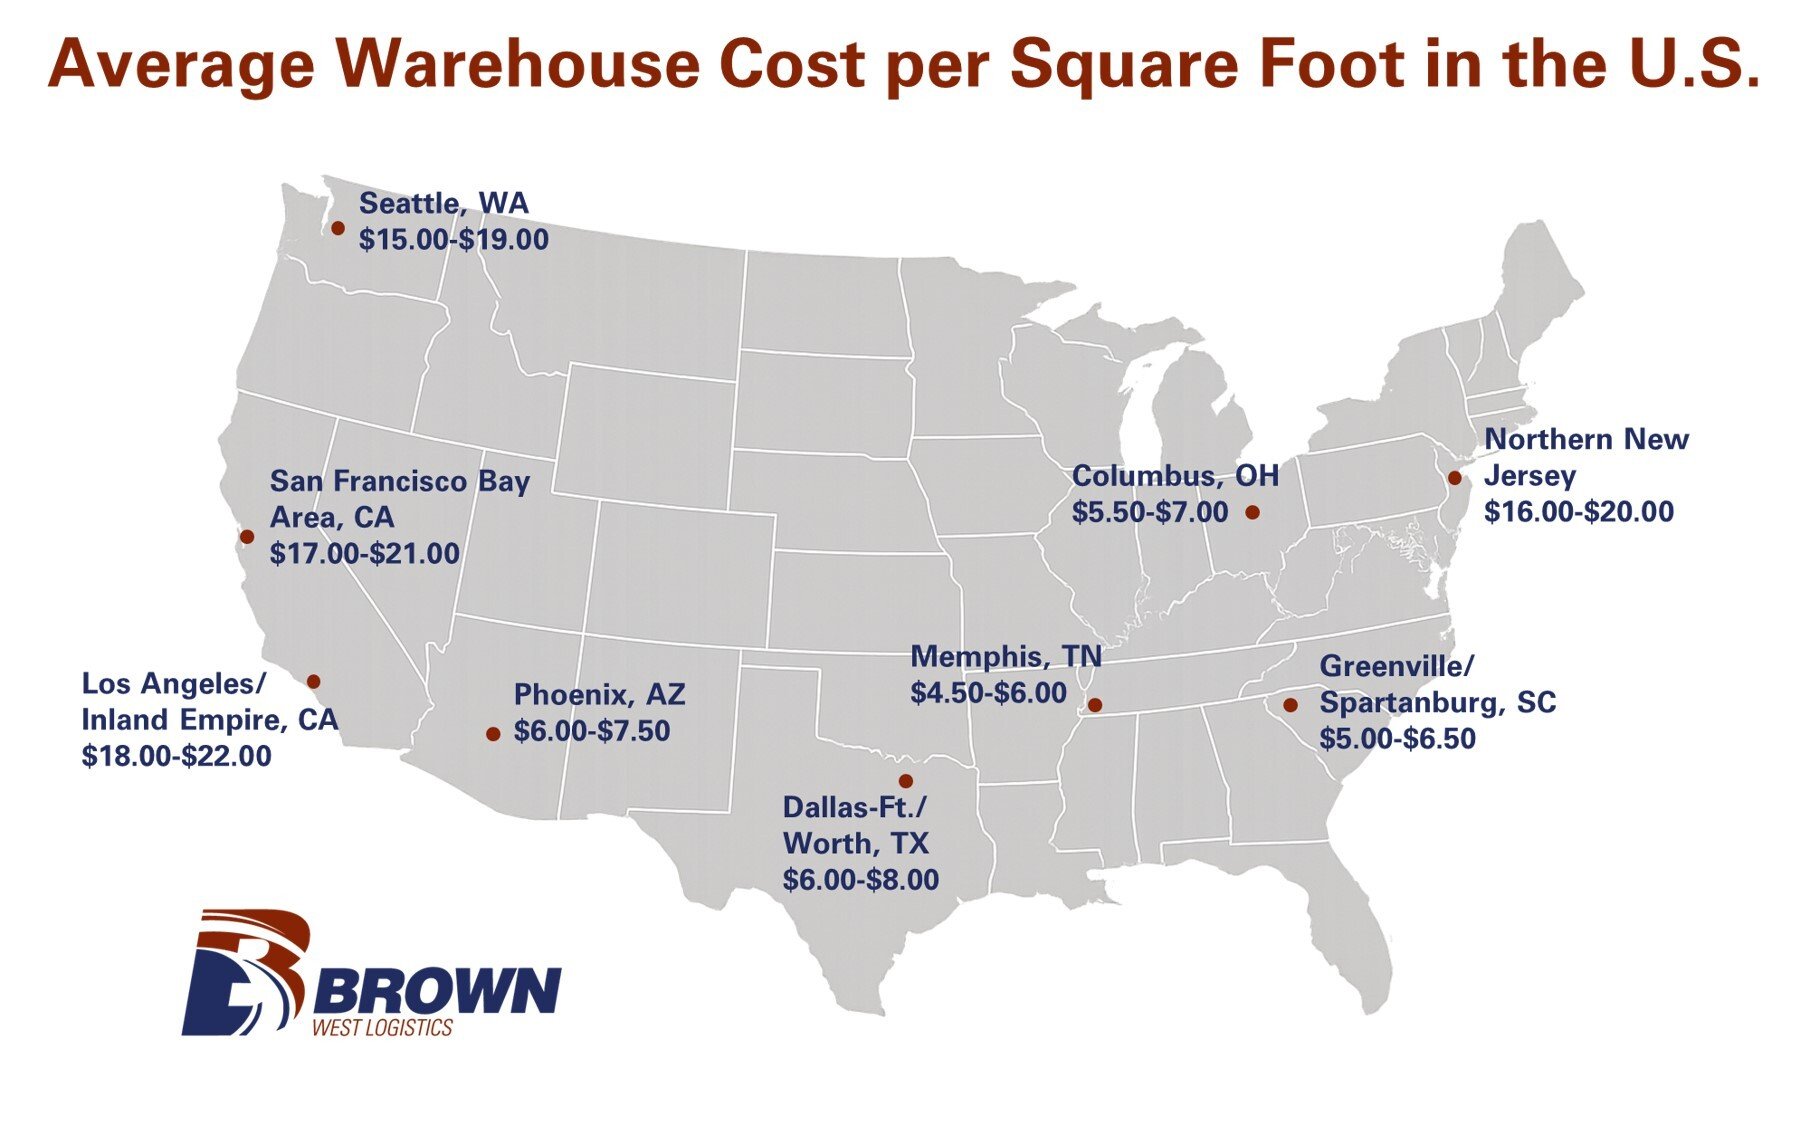
Average Warehouse Cost per Square Foot in the U.S.
Warehouse costs vary widely across the United States, driven by real estate demand, labor availability, transportation access, and market saturation. For logistics and supply chain professionals, understanding the average warehouse cost per square foot—along with which markets offer the best value—is key to making smart site selection decisions.
This post breaks down the current average warehouse rates by region, highlights the most expensive logistics hubs, and explores affordable alternatives that still offer strong distribution reach.
Average Warehouse Cost per Square Foot (2025)
As of early 2025, the national average warehouse rental rate is approximately $9.00 per square foot, up from $7.50 just two years ago. However, costs can range from under $5.00/SF in select rural areas to over $20.00/SF in high-demand urban logistics hubs.
Highest-Cost Warehouse Markets in the U.S.
These markets command a premium due to proximity to population centers, port access, and last-mile delivery demand:
Los Angeles / Inland Empire, CA: $18–$22/SF
Unmatched access to LA/Long Beach ports and major west coast distribution corridors.
Northern New Jersey: $16–$20/SF
Essential for East Coast last-mile delivery with direct access to NYC and Port Newark.
San Francisco Bay Area, CA: $17–$21/SF
Limited industrial space and strong tech-driven demand push prices sky-high.
Seattle, WA: $15–$19/SF
Port activity, high land prices, and limited developable space drive costs up.
Affordable Markets with Strong Distribution Value
While costs are lower, these regions offer strong regional or national distribution potential thanks to infrastructure and geographic reach:
Dallas-Fort Worth, TX: $6–$8/SF
Centrally located with abundant space and strong highway and rail access.
Columbus, OH: $5.50–$7.00/SF
Known as the "Crossroads of America" with 1-day access to 47% of the U.S. population.
Greenville-Spartanburg, SC: $5.00–$6.50/SF
Rapid growth, inland port access, and proximity to Southeastern markets.
Phoenix, AZ: $6.00–$7.50/SF
Attractive for West Coast overflow with lower costs and access to California, Texas, and Mexico.
Memphis, TN: $4.50–$6.00/SF
Home to FedEx’s global hub and a strategic location for nationwide distribution.
| Market | Cost Range ($/SF) | Region Type | Distribution Advantage |
| Los Angeles / Inland Empire, CA | $18.00-$22.00 | High-Cost | Port access, dense urban demand |
| Northern New Jersey | $16.00-$20.00 | High-Cost | Proximity to NYC and Port Newark |
| San Francisco Bay Area, CA | $17.00-$21.00 | High-Cost | Tech sector demand, urban proximity |
| Seattle, WA | $15.00-$19.00 | High-Cost | Port access, tight land supply |
| Dallas-Fort Worth, TX | $6.00-$8.00 | Low-Cost | Central location, strong transport links |
| Columbus, OH | $5.50-$7.00 | Low-Cost | 1-day access to 47% of U.S. |
| Greenville-Spartanburg, SC | $5.00-$6.50 | Low-Cost | Inland port, SE regional access |
| Phoenix, AZ | $6.00-$7.50 | Low-Cost | Low cost alternative to CA |
| Memphis, TN | $4.50-$6.00 | Low-Cost | FedEx hub, national reach |
Key Considerations Beyond Price
While rental rates are a critical factor, cost alone shouldn't drive your decision. Consider:
- • Labor market availability and wage rates
- • Proximity to major highways, rail, and ports
- • Tax incentives and utility costs
- • Availability of modern Class A space
Conclusion
Understanding warehouse pricing trends is more important than ever as supply chains adapt to changing consumer expectations and geographic shifts. While coastal cities command premium rates, inland and secondary markets can provide exceptional value with wide-reaching distribution capabilities.
Whether you’re expanding your footprint or looking for your first facility, balancing cost with access, labor, and logistics infrastructure is the key to long-term success.
Sources
- CBRE Industrial & Logistics Reports
https://www.cbre.com/insights - JLL Industrial Outlook Reports
https://www.us.jll.com/en/trends-and-insights - Cushman & Wakefield U.S. Industrial MarketBeat
https://www.cushmanwakefield.com/en/united-states/insights - Prologis Research
https://www.prologis.com/our-insights - NAIOP Industrial Space Demand Forecast
https://www.naiop.org - Statista
https://www.statista.com - U.S. Bureau of Labor Statistics (BLS)
https://www.bls.gov
Leave Your Comment